Back in December 2021, NetApp’s Cloud Insights (CI) added support for ONTAP’s Event Management System (EMS) alerts. I don’t know how many possible EMS alerts there are but the event catalog is only a meager 2229 pages long. From what I understand the CI team worked with the ONTAP engineering team to highlight the 75-100 or so alerts are really impactful on a day-to-day basis. For this article I just wanted to quickly highlight how to check the EMS logs and show how to create simple dashboard widgets to display them.
Log Explorer
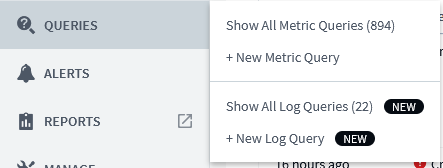
Now under Queries you can create and select log queries which, as the name indicates, are queries that directly pull from logging resources.
To get EMS log you want to select (or type in) logs.netapp.ems,
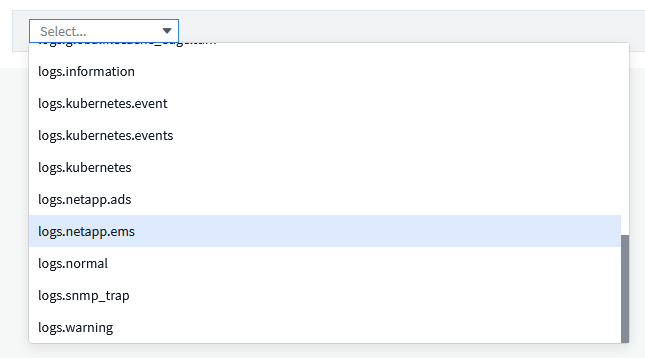
You’re going to get all the EMS logging available at first but you can quickly scale that down by adding a few filters,

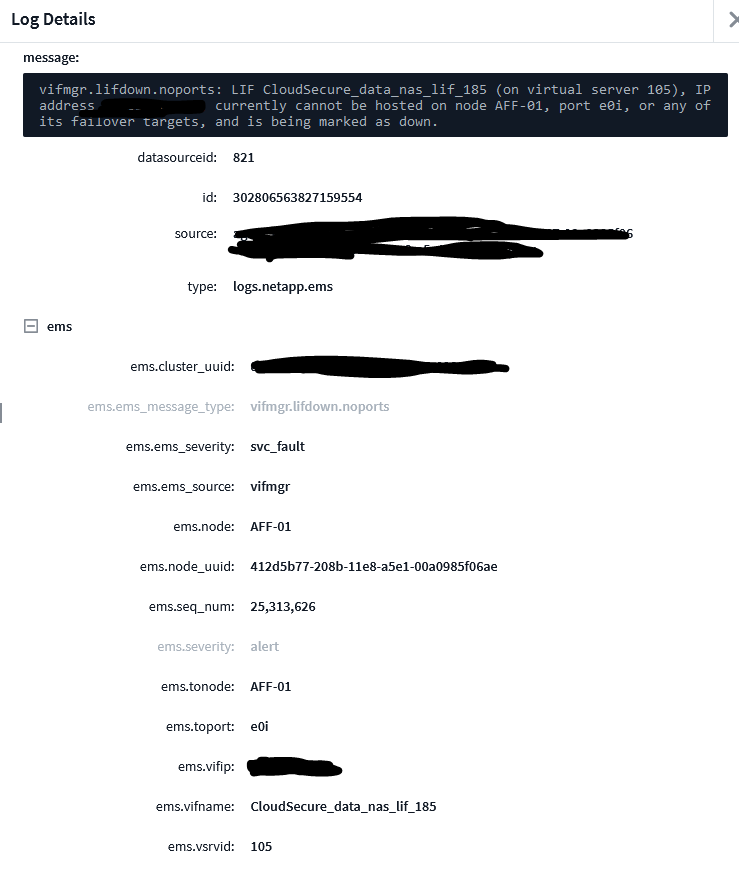
You can also get more details by clicking on the log entry down below,
Dashboard Widget
Preface, I’m not the best at making widgets. I always lean on the CI team to help me figure out the best way to design them. Thus I’m pretty sure there’s a prettier way to do this, but this is a simple and easy way to add EMS alerts to a dashboard.
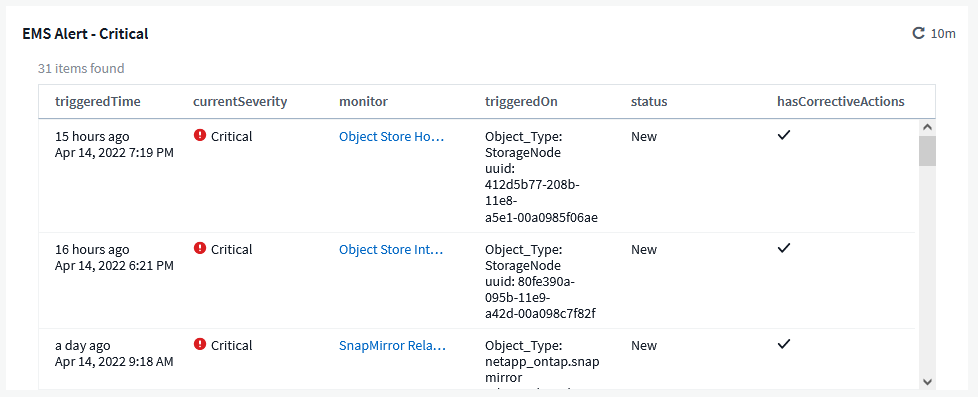
To create the above you need to add a Table widget with the first metric being Alert (not sure what they call that drop down section). You then want to set a couple of filters where monitorType is Log and monitorSource is logs.netapp.ems. You can then add a severity filter or additional filters depending on your use case. I find Critical to be most suited for this situation.

Based on my understanding once an alert has been resolved the status changes to “resolved” which will automatically clear it from the widget list.
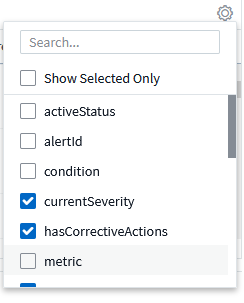
If you click the gear in the top right corner of the table you can add or remove different columns,
Congratulations! You’ve now taken a step into the wide, wide world of ONTAP EMS notifications.
Additional Resources
- Cloud Insights Log Explorer (official documentation)
Article History
- 4/15/22 – Initial Posting
